Two numbers do not tell you what a fifteen-centimetre difference looks like. A picture does, in about a second, which is the whole reason these charts exist. Here is how to make one that is right as well as convincing.
# How to make a height comparison chart
Two numbers do not tell you what a fifteen-centimetre difference looks like. A picture does, in about a second, which is the whole reason these charts exist. Here is how to make one that is right as well as convincing.
[Open the Height Comparison Chart](https://abox.tools/compare-heights/): Type the heights, take the picture. Nothing is sent to draw it.
Last updated 12 October 2026
## The short answer
Open the [Height Comparison Chart](https://abox.tools/compare-heights/). Two people are already on it; type your heights over theirs — `178` or `5'10"`, whichever way you write them — add a doorway from the menu so there is something familiar on the picture, and download the PNG.
That is nearly all of it. The rest of this page is the four decisions that make the difference between a chart that is convincing and one that is also correct: how the heights are read, which figure goes with which person, what to put on the chart beside people, and what "share this chart with a link" quietly costs.
## Why a chart beats two numbers
"He is 178 and she is 165" is a sentence almost nobody can picture. Thirteen centimetres is the width of a hand, and whether that reads as "about the same" or "noticeably taller" depends entirely on what you set it against. A chart answers that by drawing both against the same ruler, on the same ground, at the same scale — which is a thing a sentence cannot do however carefully it is written.
It is also the reason these charts get used for arguments: about actors, about characters, about whether the new sofa will actually go under the window. In every one of those the picture is the argument, so the picture has to be right.
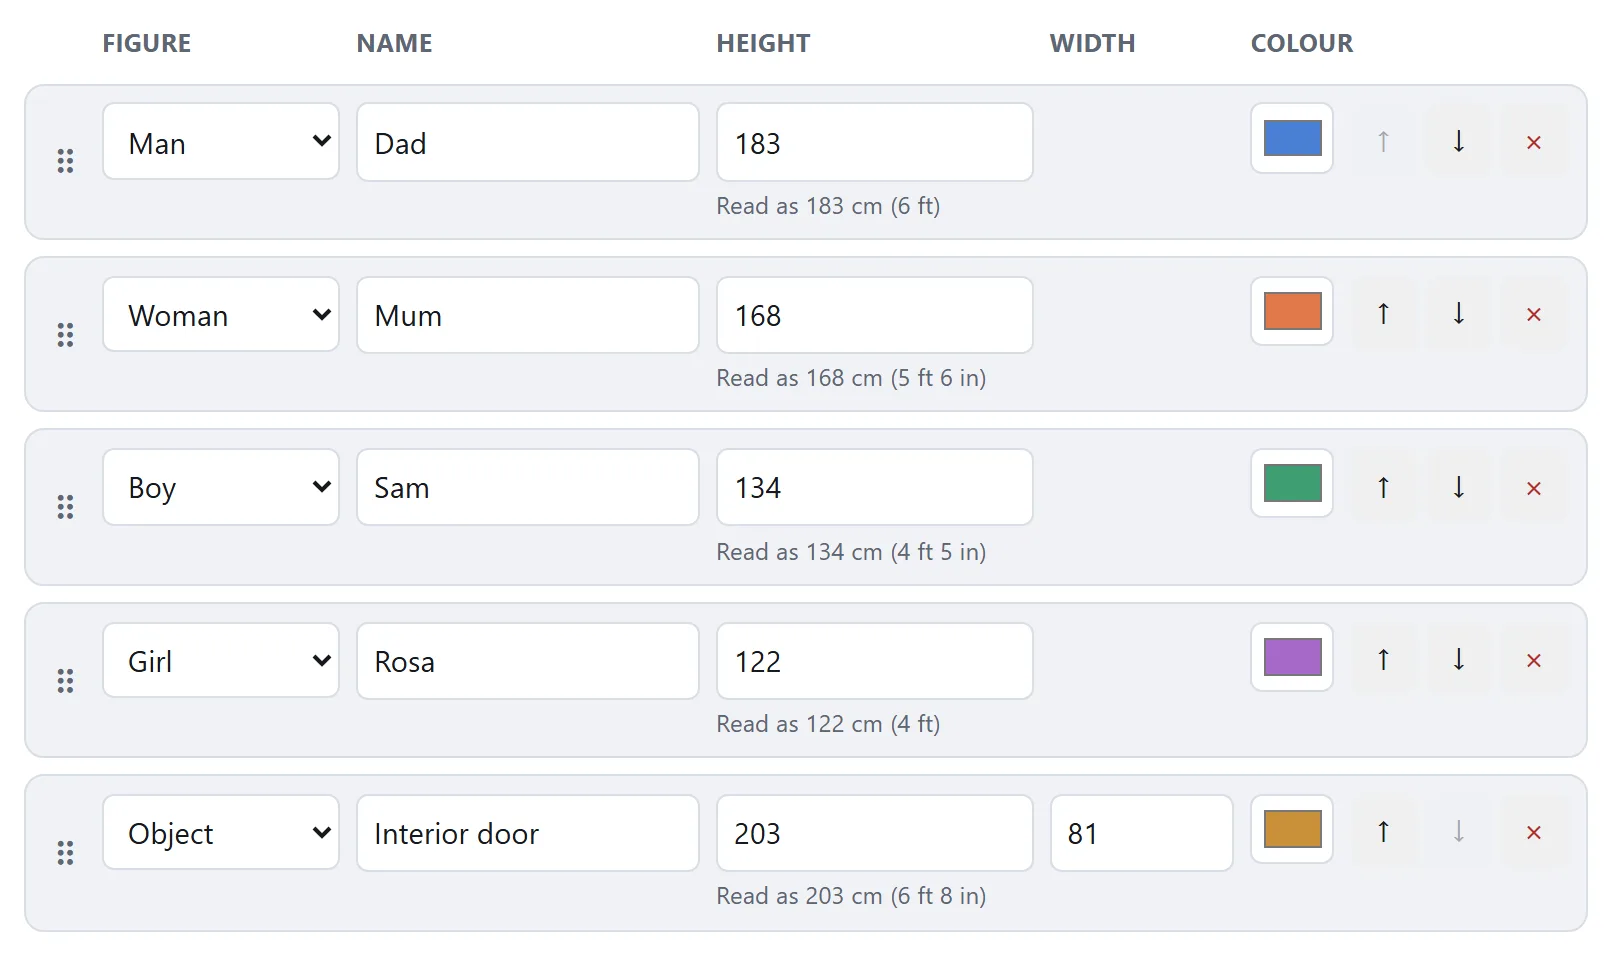
One row per person. The line under each height box is the reading — what the tool understood, in both systems — so a misread is visible before it is drawn.
## Decision one: how you write the heights
Type them however you normally write them. All of these are read correctly, in any row, in any mix:
- `173` and `173 cm`
- `1.73 m`
- `5'8"`, `5'8`, `5 ft 8 in` and `5ft8`
- `68 in` and `68"`
Two of those are genuinely ambiguous and are resolved by a rule rather than by luck. A **bare number** is centimetres when the chart is metric and inches when it is imperial. A **bare number under three** is metres, because 1.73 cm is not a height anybody types.
You never have to remember either, because the line under the box shows what was understood in both systems. If it says *Read as 173 cm (5 ft 8 in)*, the picture is about to be right. That line is the single most useful thing on the page, and the reason to glance at it every time you paste a number in from somewhere else.
One thing is refused rather than guessed: `5'14"`. Fourteen inches is a foot and two, so somebody has not carried the twelve, and a tool that quietly turned it into 6'2" would be drawing a person nobody described.
## Decision two: which figure goes with which person
This is the decision most people skip and the one that does the most work. **A small person is not a scaled-down large one.** Body proportions change with age, and the head is where they change most:
- a two-year-old is about **four and a half** head-heights tall;
- an eight-year-old about **six**;
- an adult about **seven and a half**.
So a child's head is a much bigger share of the child than an adult's is of the adult. A chart that draws one silhouette at four different sizes gets that wrong in every row but one, and the result looks subtly off in a way most people cannot name and all of them notice — the small figures read as tiny adults rather than as children.
So pick the figure that matches the person. **Boy** and **Girl** are drawings of actual children rather than adults made small, which is the whole reason a family chart made here looks like a family.
All four figures are public-domain artwork by other people. We did not find toddler or baby artwork that met this tool’s licensing and drawing requirements. For a younger child, set a shipped child figure to the measured height or add a suitable picture of your own; the ruler carries the measurement.
## Decision three: put something familiar on it
A chart of three people tells you how they compare with each other. A chart of three people and a doorway tells you how tall they are. That is a different and much more useful thing, and it costs one row.
The menu holds twenty to start from, in four groups: doors and windows, a classroom whiteboard and the rest of an office, things you meet in the street — a vending machine, a wheelie bin, a basketball hoop, a 20 ft shipping container — and the furniture at home. A few of those are genuine standards: a container is 259 cm tall by definition, a basketball rim is 305, an American interior door is 203 by 81. The rest are typical rather than fixed, because doors, windows and worktops vary by country and by house, and each arrives as an ordinary row you can measure and type over. An object takes a width as well as a height, so a door is 203 by 81 rather than a stripe.
Most of them arrive drawn rather than as a plain block — a door with a handle, a fridge with its freezer above it, a sofa you can see is a sofa. The drawing is fitted to the two numbers in the row, so the numbers still decide the size and typing your own over them still works. Three have no drawing and arrive as a rectangle: the basketball hoop, the shipping container and the kitchen counter.
If the chart is about a piece of furniture rather than a person, this is the whole tool: one object at the real dimensions, one person at their real height, and the question answers itself.
And when nothing in the menu is the thing you mean, **Add your own picture** takes a drawing or a photograph off your machine and puts it on the ruler — a product, a vehicle, a building, or a photo of the thing itself.
An **SVG** is drawn in one solid colour, like everything else on the chart, so a drawing made of thin outlines rather than filled shapes arrives as a blob. Only its shapes are kept: the file is rebuilt out of its paths and circles, and a script, a stylesheet, a font or a linked image is left behind. A **photo or a PNG** goes on as itself instead and keeps its own colours — redrawn here first, which bounds what it adds to the chart and leaves the file's metadata behind. Transparency is kept, so a cut-out stands cleanly and a photo brings its background with it.
Neither file goes anywhere. The chart you download does, though, and it should not carry somebody's server address into it — which is why what ends up in it is shapes and pixels, never a link.
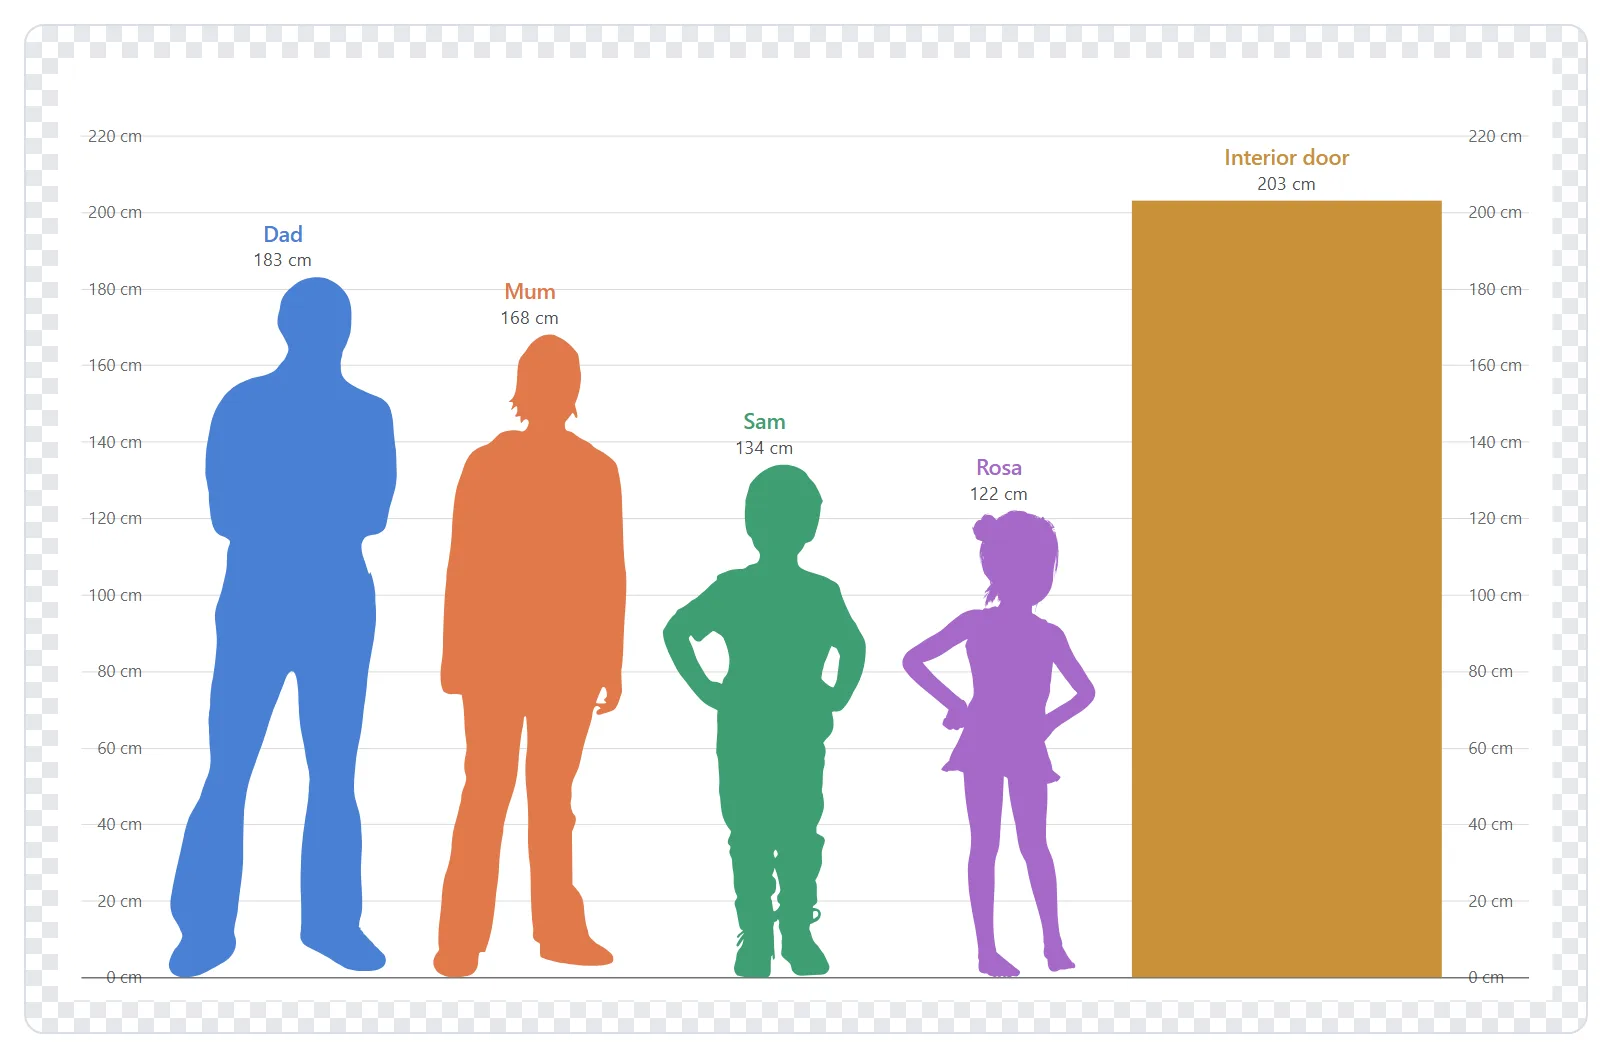
Four people and a doorway on one ruler. The doorway is what turns "she is 122" into something you can see.
## Decision four: centimetres or feet
Set the ruler to whatever your reader thinks in. Switching between the two rewrites what is in the boxes rather than reinterpreting it — `178` becomes `5'10"` — so nobody's height moves when you change the notation. That matters more than it sounds: a bare `178` read as inches would be a four-and-a-half-metre person, drawn confidently.
The imperial ruler is marked in whole inches: one, three, six, twelve or twenty-four of them between lines, chosen by how many lines the picture can carry. The metric one works the same way, which is why a chart of two adults gets a line every ten centimetres and a chart with a basketball hoop on it gets one every twenty-five. Ninety lines on one picture is a grey wash rather than a ruler.
## Getting the picture out
**The PNG** is for pasting: a document, a slide, a message, a forum post. It comes out at whatever pixel height you set, so if it is going somewhere that will show it large, set the height higher before you download rather than enlarging it afterwards.
**The SVG** is for keeping. It is the chart as instructions rather than as pixels, so it prints sharp at any size and can be opened and recoloured later in any vector editor. If the chart is going into something that will be printed — a poster, a report, a leaflet — take the SVG.
If the chart is going onto a coloured slide, set the background to roughly the colour it will sit on. The ruler and the writing switch between dark and light to stay legible against it. Then tick *no background at all* and the picture itself comes out transparent, with the ink still chosen for the colour you named.
## The thing to know about "share with a link"
Most height chart sites offer one, and it is worth understanding what it is. There is no server storing your chart, so the link has to carry the chart — which means every name and every height is written into the address itself.
An address is the most widely logged thing on the internet. It goes into the chat server you paste it into, the mail scanner it passes through, the browser history of everyone who opens it, the link-preview fetcher that visits it before anybody has clicked. For a chart of two actors that is nothing. For a chart of your children, with their names and how tall each of them is and their ages implied by the figures beside them, it is a thing worth not doing by accident.
This tool has no such link, and the address of the page never changes as you type. Download the picture and send that: it says exactly the same thing and carries no list with it. Nothing you type here is stored between visits either — close the tab and the chart is gone — which is the other half of the same trade, and the reason a chart worth keeping is one worth downloading.
The longer version of that argument, and how to tell which sites need your file at all, is in [Is it safe to upload files to a website?](https://abox.tools/guides/is-it-safe-to-upload-files/)
The short answer
Open the Height Comparison Chart. Two people are already on it; type your heights over theirs — 178 or 5'10", whichever way you write them — add a doorway from the menu so there is something familiar on the picture, and download the PNG.
That is nearly all of it. The rest of this page is the four decisions that make the difference between a chart that is convincing and one that is also correct: how the heights are read, which figure goes with which person, what to put on the chart beside people, and what "share this chart with a link" quietly costs.
Why a chart beats two numbers
"He is 178 and she is 165" is a sentence almost nobody can picture. Thirteen centimetres is the width of a hand, and whether that reads as "about the same" or "noticeably taller" depends entirely on what you set it against. A chart answers that by drawing both against the same ruler, on the same ground, at the same scale — which is a thing a sentence cannot do however carefully it is written.
It is also the reason these charts get used for arguments: about actors, about characters, about whether the new sofa will actually go under the window. In every one of those the picture is the argument, so the picture has to be right.
One row per person. The line under each height box is the reading — what the tool understood, in both systems — so a misread is visible before it is drawn.
Decision one: how you write the heights
Type them however you normally write them. All of these are read correctly, in any row, in any mix:
173 and 173 cm
1.73 m
5'8", 5'8, 5 ft 8 in and 5ft8
68 in and 68"
Two of those are genuinely ambiguous and are resolved by a rule rather than by luck. A bare number is centimetres when the chart is metric and inches when it is imperial. A bare number under three is metres, because 1.73 cm is not a height anybody types.
You never have to remember either, because the line under the box shows what was understood in both systems. If it says Read as 173 cm (5 ft 8 in), the picture is about to be right. That line is the single most useful thing on the page, and the reason to glance at it every time you paste a number in from somewhere else.
One thing is refused rather than guessed: 5'14". Fourteen inches is a foot and two, so somebody has not carried the twelve, and a tool that quietly turned it into 6'2" would be drawing a person nobody described.
Decision two: which figure goes with which person
This is the decision most people skip and the one that does the most work. A small person is not a scaled-down large one. Body proportions change with age, and the head is where they change most:
a two-year-old is about four and a half head-heights tall;
an eight-year-old about six;
an adult about seven and a half.
So a child's head is a much bigger share of the child than an adult's is of the adult. A chart that draws one silhouette at four different sizes gets that wrong in every row but one, and the result looks subtly off in a way most people cannot name and all of them notice — the small figures read as tiny adults rather than as children.
So pick the figure that matches the person. Boy and Girl are drawings of actual children rather than adults made small, which is the whole reason a family chart made here looks like a family.
All four figures are public-domain artwork by other people. We did not find toddler or baby artwork that met this tool’s licensing and drawing requirements. For a younger child, set a shipped child figure to the measured height or add a suitable picture of your own; the ruler carries the measurement.
Decision three: put something familiar on it
A chart of three people tells you how they compare with each other. A chart of three people and a doorway tells you how tall they are. That is a different and much more useful thing, and it costs one row.
The menu holds twenty to start from, in four groups: doors and windows, a classroom whiteboard and the rest of an office, things you meet in the street — a vending machine, a wheelie bin, a basketball hoop, a 20 ft shipping container — and the furniture at home. A few of those are genuine standards: a container is 259 cm tall by definition, a basketball rim is 305, an American interior door is 203 by 81. The rest are typical rather than fixed, because doors, windows and worktops vary by country and by house, and each arrives as an ordinary row you can measure and type over. An object takes a width as well as a height, so a door is 203 by 81 rather than a stripe.
Most of them arrive drawn rather than as a plain block — a door with a handle, a fridge with its freezer above it, a sofa you can see is a sofa. The drawing is fitted to the two numbers in the row, so the numbers still decide the size and typing your own over them still works. Three have no drawing and arrive as a rectangle: the basketball hoop, the shipping container and the kitchen counter.
If the chart is about a piece of furniture rather than a person, this is the whole tool: one object at the real dimensions, one person at their real height, and the question answers itself.
And when nothing in the menu is the thing you mean, Add your own picture takes a drawing or a photograph off your machine and puts it on the ruler — a product, a vehicle, a building, or a photo of the thing itself.
An SVG is drawn in one solid colour, like everything else on the chart, so a drawing made of thin outlines rather than filled shapes arrives as a blob. Only its shapes are kept: the file is rebuilt out of its paths and circles, and a script, a stylesheet, a font or a linked image is left behind. A photo or a PNG goes on as itself instead and keeps its own colours — redrawn here first, which bounds what it adds to the chart and leaves the file's metadata behind. Transparency is kept, so a cut-out stands cleanly and a photo brings its background with it.
Neither file goes anywhere. The chart you download does, though, and it should not carry somebody's server address into it — which is why what ends up in it is shapes and pixels, never a link.
Four people and a doorway on one ruler. The doorway is what turns "she is 122" into something you can see.
Decision four: centimetres or feet
Set the ruler to whatever your reader thinks in. Switching between the two rewrites what is in the boxes rather than reinterpreting it — 178 becomes 5'10" — so nobody's height moves when you change the notation. That matters more than it sounds: a bare 178 read as inches would be a four-and-a-half-metre person, drawn confidently.
The imperial ruler is marked in whole inches: one, three, six, twelve or twenty-four of them between lines, chosen by how many lines the picture can carry. The metric one works the same way, which is why a chart of two adults gets a line every ten centimetres and a chart with a basketball hoop on it gets one every twenty-five. Ninety lines on one picture is a grey wash rather than a ruler.
Getting the picture out
The PNG is for pasting: a document, a slide, a message, a forum post. It comes out at whatever pixel height you set, so if it is going somewhere that will show it large, set the height higher before you download rather than enlarging it afterwards.
The SVG is for keeping. It is the chart as instructions rather than as pixels, so it prints sharp at any size and can be opened and recoloured later in any vector editor. If the chart is going into something that will be printed — a poster, a report, a leaflet — take the SVG.
If the chart is going onto a coloured slide, set the background to roughly the colour it will sit on. The ruler and the writing switch between dark and light to stay legible against it. Then tick no background at all and the picture itself comes out transparent, with the ink still chosen for the colour you named.
The thing to know about "share with a link"
Most height chart sites offer one, and it is worth understanding what it is. There is no server storing your chart, so the link has to carry the chart — which means every name and every height is written into the address itself.
An address is the most widely logged thing on the internet. It goes into the chat server you paste it into, the mail scanner it passes through, the browser history of everyone who opens it, the link-preview fetcher that visits it before anybody has clicked. For a chart of two actors that is nothing. For a chart of your children, with their names and how tall each of them is and their ages implied by the figures beside them, it is a thing worth not doing by accident.
This tool has no such link, and the address of the page never changes as you type. Download the picture and send that: it says exactly the same thing and carries no list with it. Nothing you type here is stored between visits either — close the tab and the chart is gone — which is the other half of the same trade, and the reason a chart worth keeping is one worth downloading.

